
Text Mining
PROBLEM: Determining Severity of Patient Tweets Using Natural Language Processing For Appropriate Action by Case Managers.
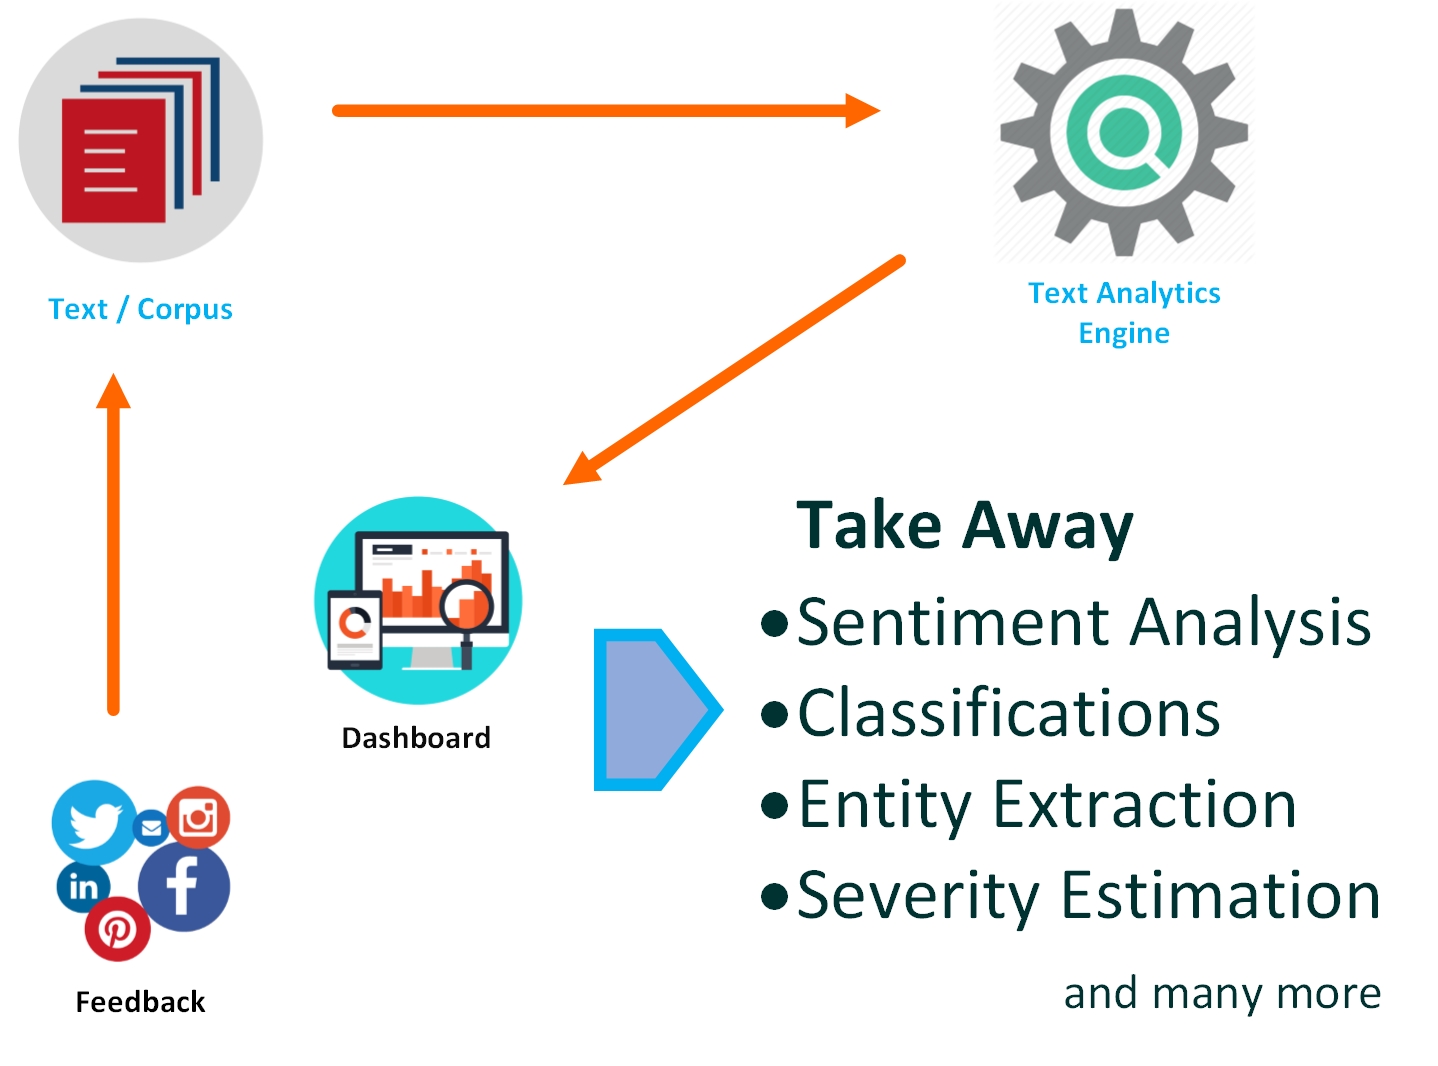
Diabetes Patients participating in a study were asked to report their problems and daily symptoms encountered as well as any important information they wanted to communicate to their doctors in daily tweets. The problem was to assess severity of the tweets so that appropriate timely action could be taken.
SOLUTION: AnalyticsPlus analyzed these text messages to identify emotions expressed by the patients, the overall polarity of the note, with keyword extraction using the Snomed database to classify these notes into different priority levels so that Case Managers could take appropriate action based on severity.
BENEFIT: This process allows Case Managers to spend more times on patients experiencing more severe symptoms.
Tools Used R, Snomed Database
Pharma

PROBLEM: Meta-Analysis to determine Most Effective Treatments and Dosages by Combining Results from Different Studies
When Comparing Different Competing Treatments at different dosages it is often not possible to do this in only one study because of ethical, monetary and other constraints. The task here is used to combine results from several studies which meet certain criteria and compares some but not all of these treatments at some of these dosages and make meaningful interpretations for all of the treatments at all of these dosages.
SOLUTION:We compared treatments for our client using Models and links like Conditional Binomial Likelihood, with probit link, random and fixed effects model, binomial likelihood, logit link, random & fxed effect models and created network diagrams and rankograms with best probability calculation. For this purpose we did pairwise meta-analysis and indirect treatment comparison. Both frequentist and Bayesian framework comparisons were made and patient characteristics were also analyzed.
BENEFIT: The cost of new clinical trials to test all possible combinations of treatments and dosages were avoided by our clients and our models were used to determine the effective dosages of treatments and identify most effective treatment and dosages for different levels of diseases.
Tools: R, Stata, WinBugs
Signal Processing
PROBLEM: Automated detection of Arrhythmias from ECG Reports
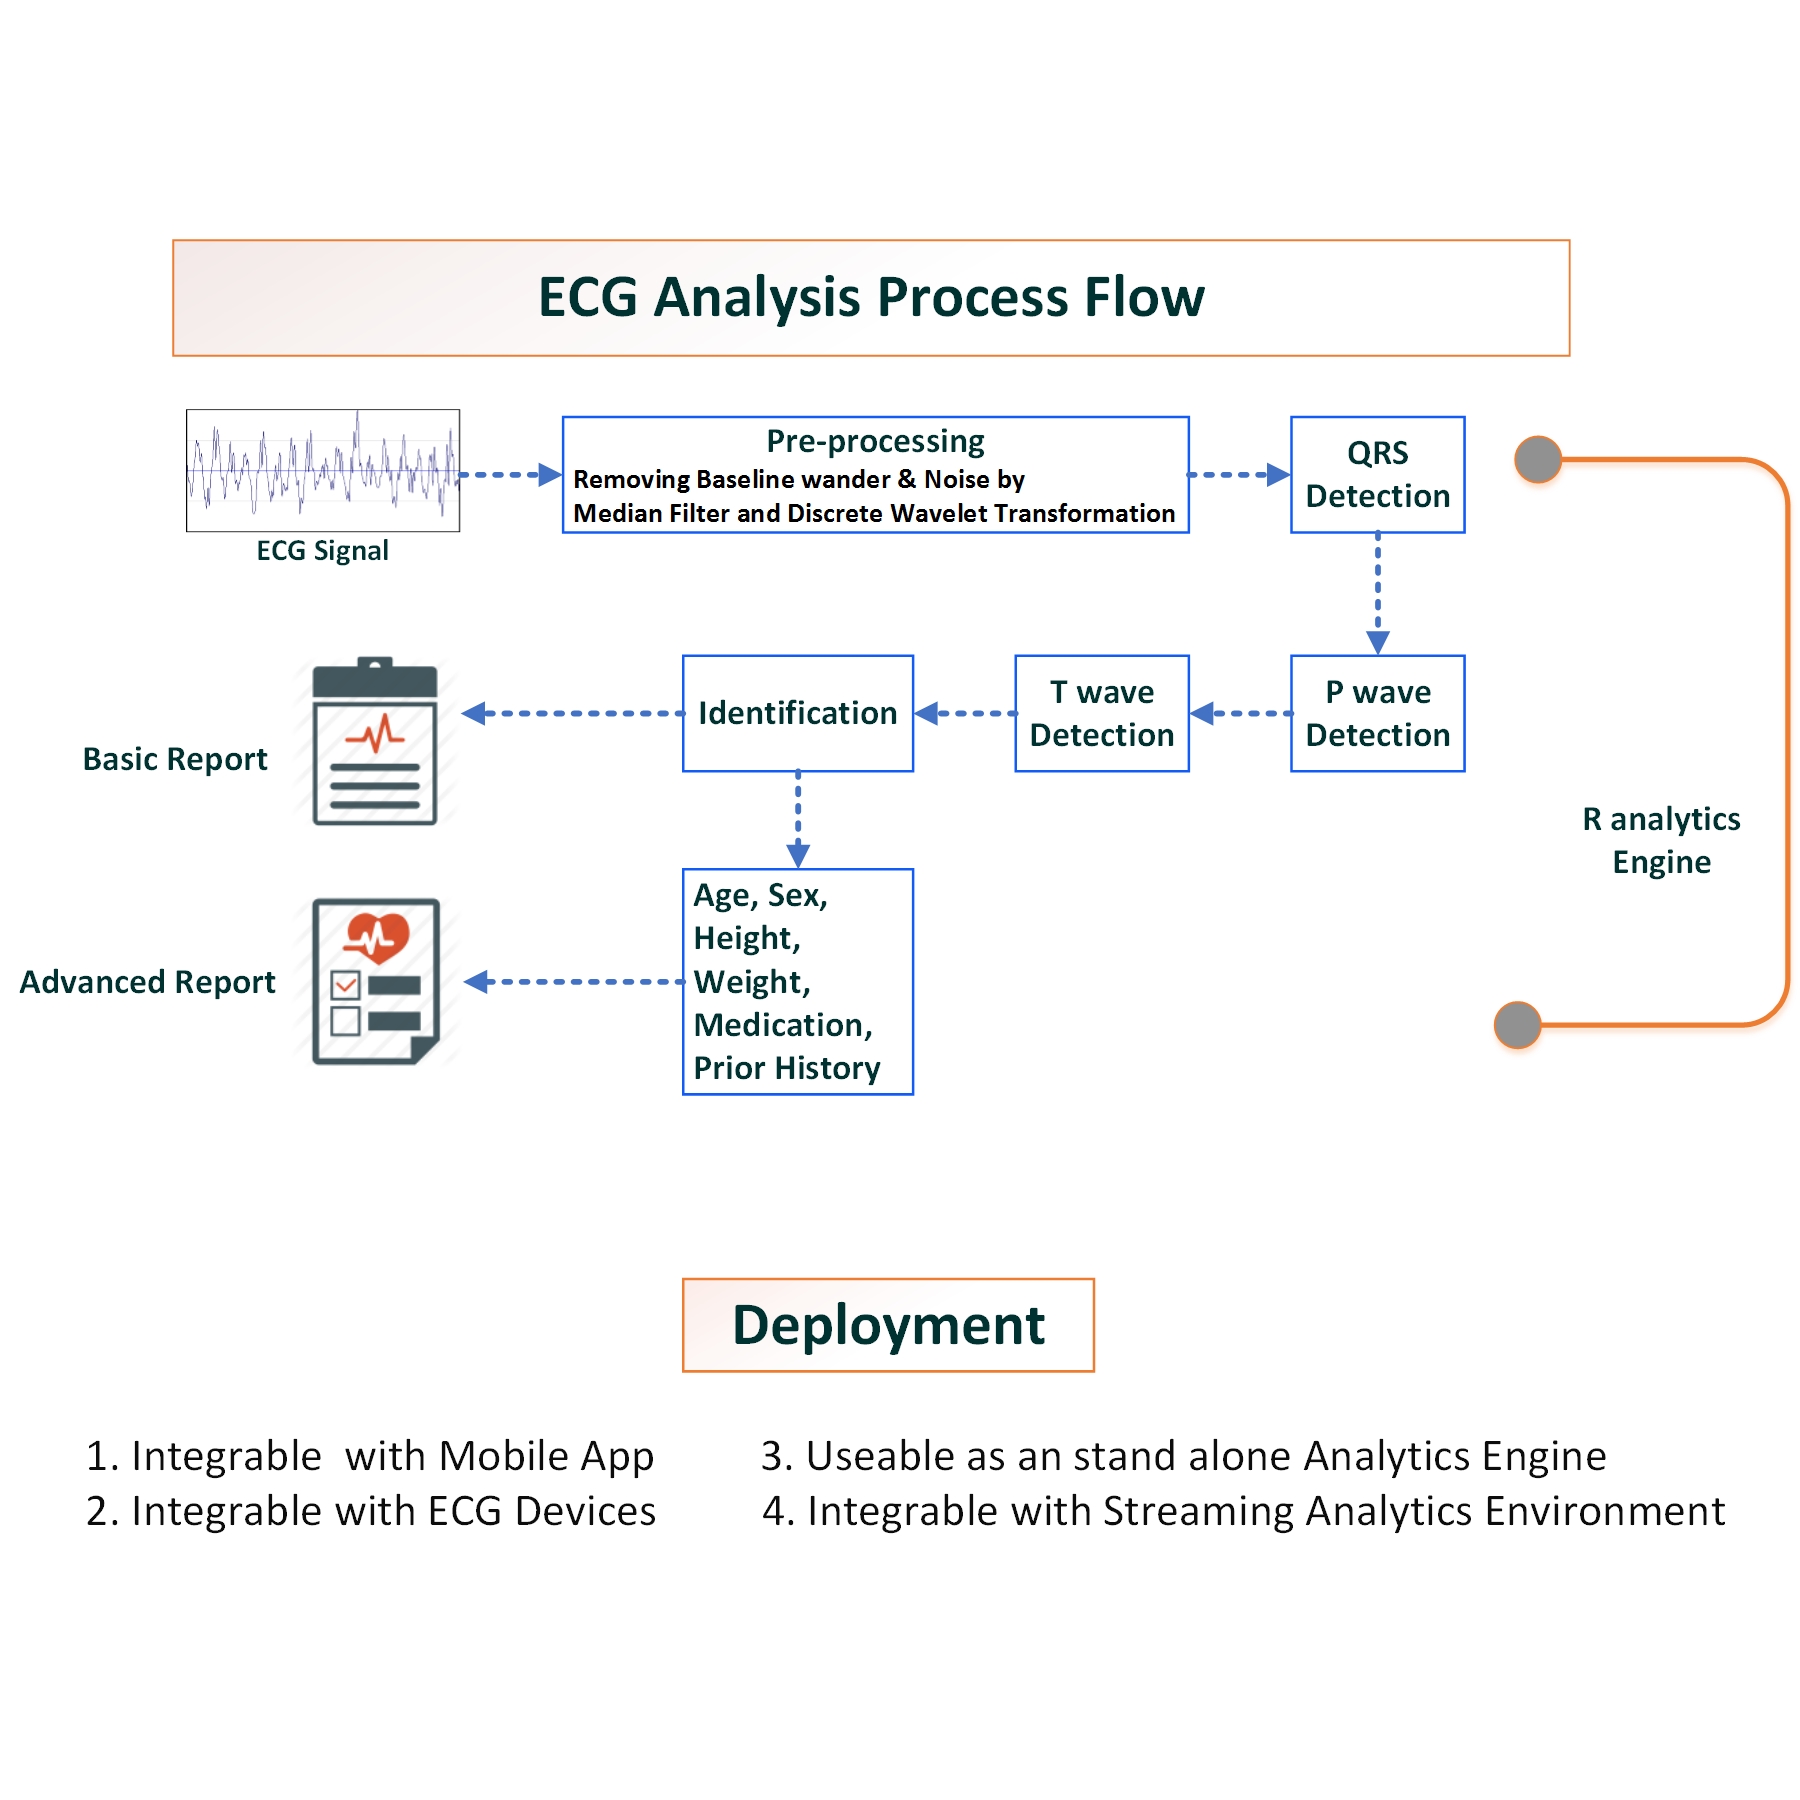
Since both Doctors and patients are busy it is not always possible for the patient to visit the doctor, have an ECG done and get it checked manually. There is a need for reliable automated analysis of ECG Reports for patients who are away from their doctors so that timely interventions can be made to prevent readmissions and Emergency Room visits.
SOLUTION: Analytics Plus has developed an algorithm, working with publicly available ECG records to detect the presence of bradycardia, tachycardia, atrial fibrillation and atrial flutter through machine learning algorithms. This algorithm can be integrated with a mobile app that allows the patients to take an ECG reading from their mobile which is analyzed by this computer generated algorithm and forwarded to their physician. The report is prioritized whenever the algorithm detects abnormalities so that the report is personally reviewed by the Physician and recommendations sent immediately back to the patient.
BENEFIT: Patients can receive recommendations from the doctor even when they are travelling and possible readmissions and emergency room visits can be avoided.
Tools Used: R, Tableau
Insurance
PROBLEM: Workers Compensation Claims Triaging- Identifying Expensive Claims Early in their Life Cycle
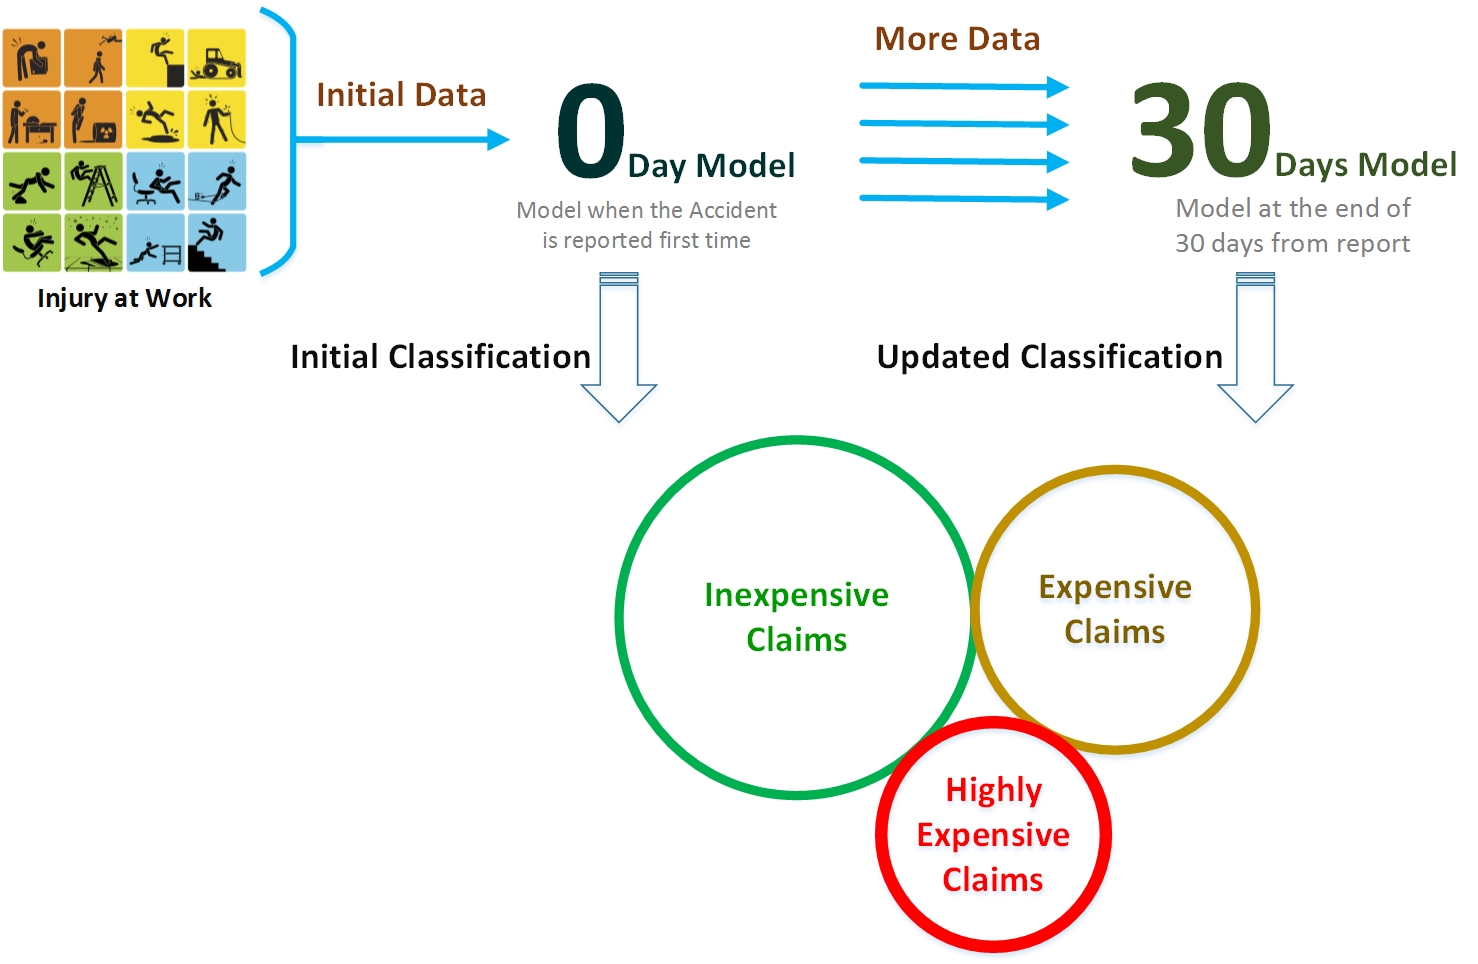
When the claim is first generated, only minimum information is available. The assessors allocate funds based on their experience and often opportunities are lost where escalation could have been prevented by taking appropriate steps at the right time. Again, when more information becomes available at a later date the best use of this information is important to make appropriate adjustment to allocated resources.
SOLUTION: AnalyticsPlus Developed a scoring algorithm to identify expensive claims at the 0-th day or the day they are first reported. Proprietary algorithms were used to create a Severity Index that assessed the likelihood of the claim escalating rapidly by combining claim related injury related data available on the claim and each claim was scored at 0-daya. This score was updated using another model making use of variables available at this stage at the 30 day stage.
BENEFIT: The High Predictive accuracy of these models allowed our clients to assign appropriate resources to these claims early on in their lifecycle helping them reduce the ultimate costs on these claims.
Tools Used: R
DATA QUALITYSENSE
Quality Assessment, Cleansing, and Reporting of Medical Devices and Health Sensor
DATA (QUALITYSENSE)
As a data analytics company, AnalyticsPlus has extensive experience in health care data quality assessment and cleansing. While humanly collected data has issues related to missing, incorrect data entries of different varieties, data duplication, and many others , all kinds of data in health whether sourced from EMR, claims, or patient surveys require significant quality assessment and cleansing before they can be used for analysis, reporting and visualization. The problem is compounded when multiple sources and types of data are merged together to meet the statistical or machine—learning based analytics or predictive modeling. As the number of health sensor and medical devices becoming available to patients are increasing exponentially, the need for data quality assessment, cleansing and validation is also increasing.
We are developing a “clearing house” of 100s of health sensor data through a systematic quality assessment, cleansing, and reporting platform, called QualitySense, that can be integrated with the Electronic Medical Record of health care facilities. Thus, all the data coming from these personal-sensors can be vetted and a seal of “AnalyticsPlus Approval” can be designated for those devices. Unlike one time FDA approval process, QualitySense system will be processing data coming from these devices on a real time basis and validating them or flagging them by comparing within device variability, calibration data, and inter-device variability. Thus, the hospital management and their care providers have a constant visibility and can see which devices/brands are more reliable than others and encourage their patients to use those accordingly. A layered or sequential pipeline approach to data quality assessment and cleansing has been developed using streaming data analytics infrastructure.
QualitySense will be our proprietary data quality tool to be used universally. It will enable cleansing and monitoring of data quality on an ongoing basis, helping to turn input data into trusted information. This Application will use appropriate business rules at data entry, during continuous streaming, and at the end point, and scale to cleanse millions of rows of static or dynamic data to provide trusted information for Data Analysis.